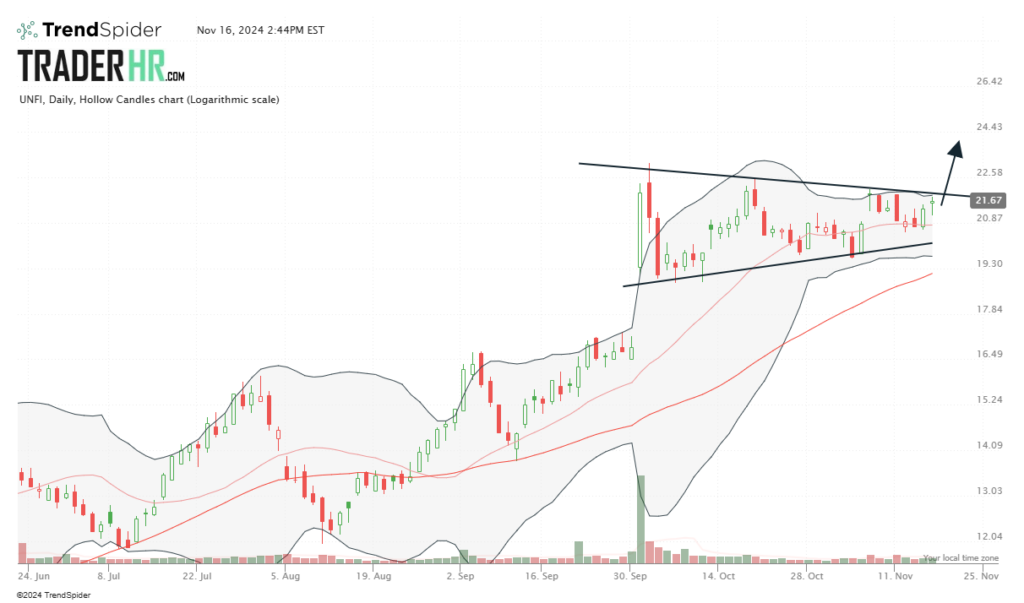
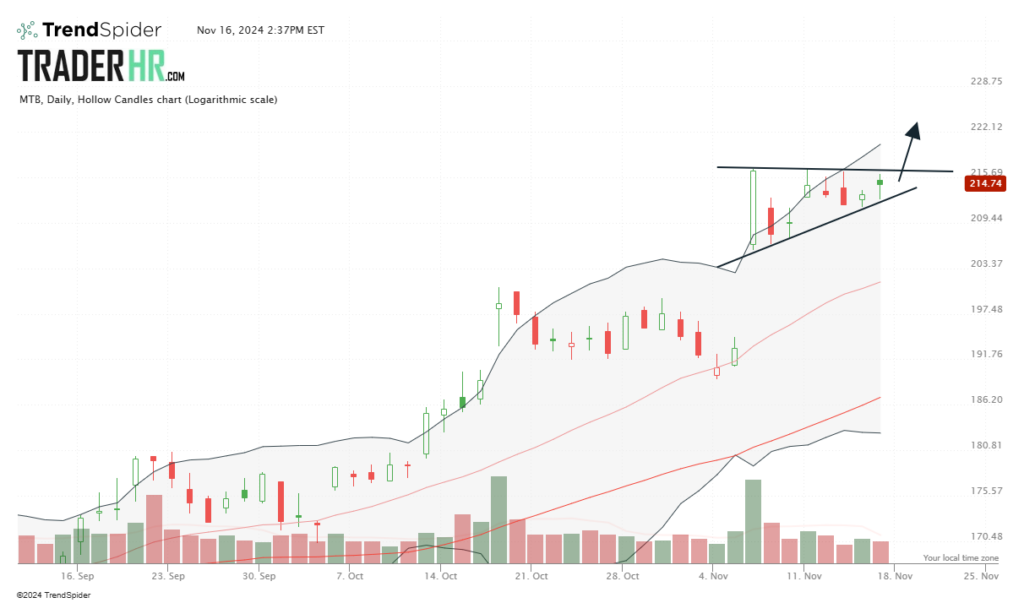
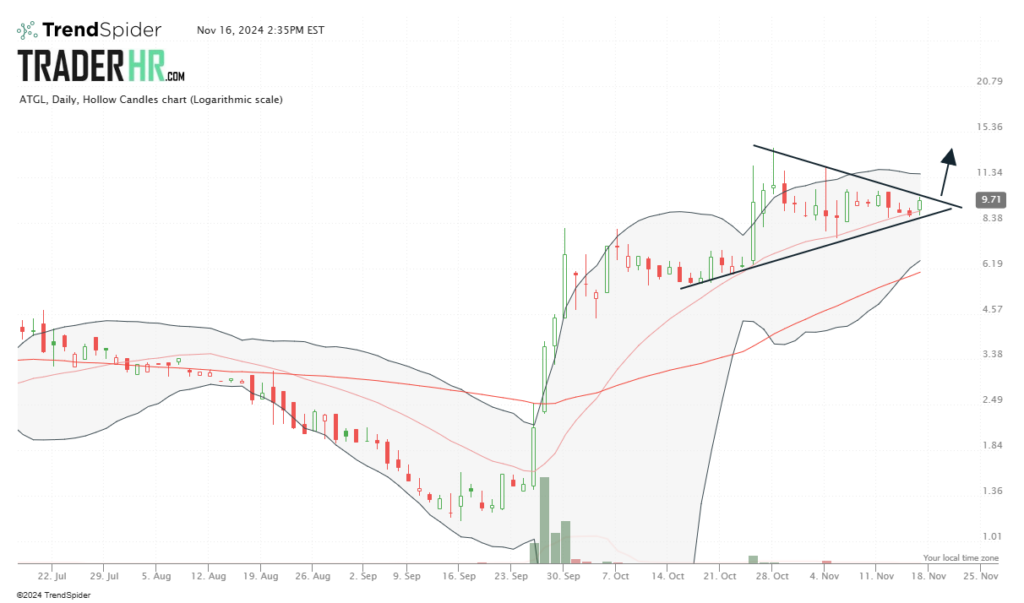
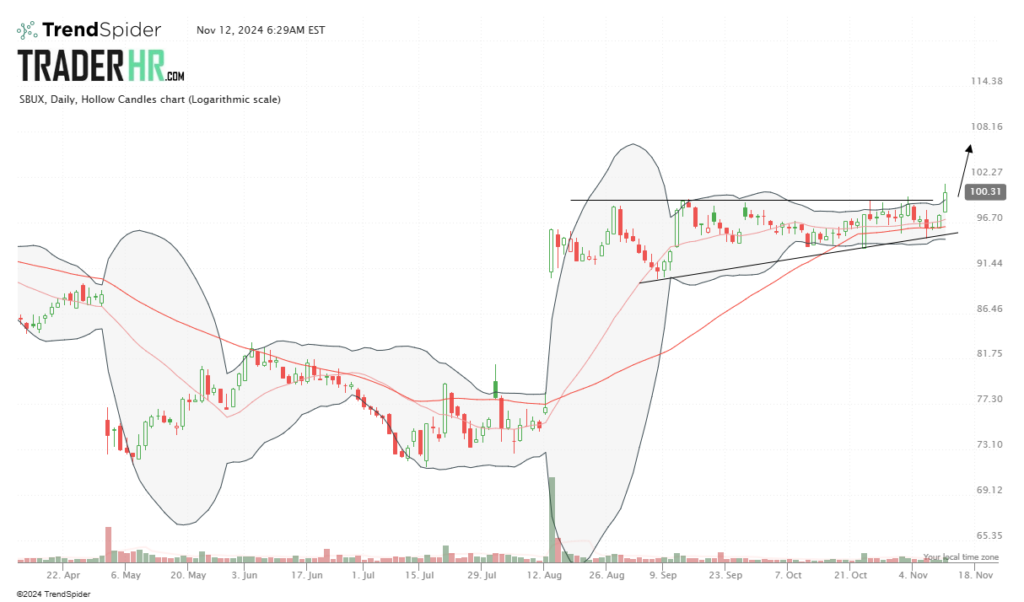
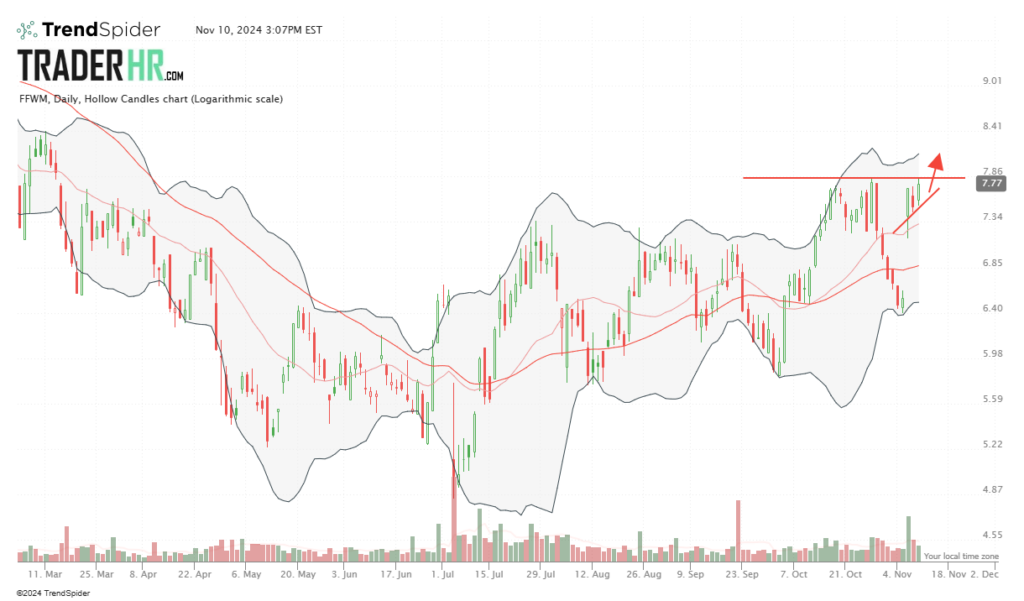
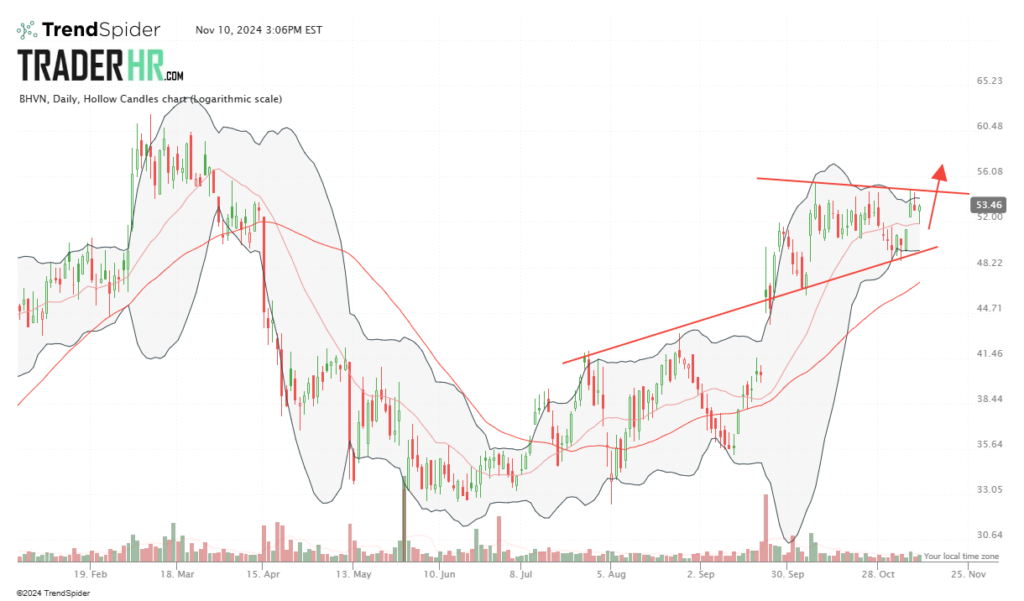
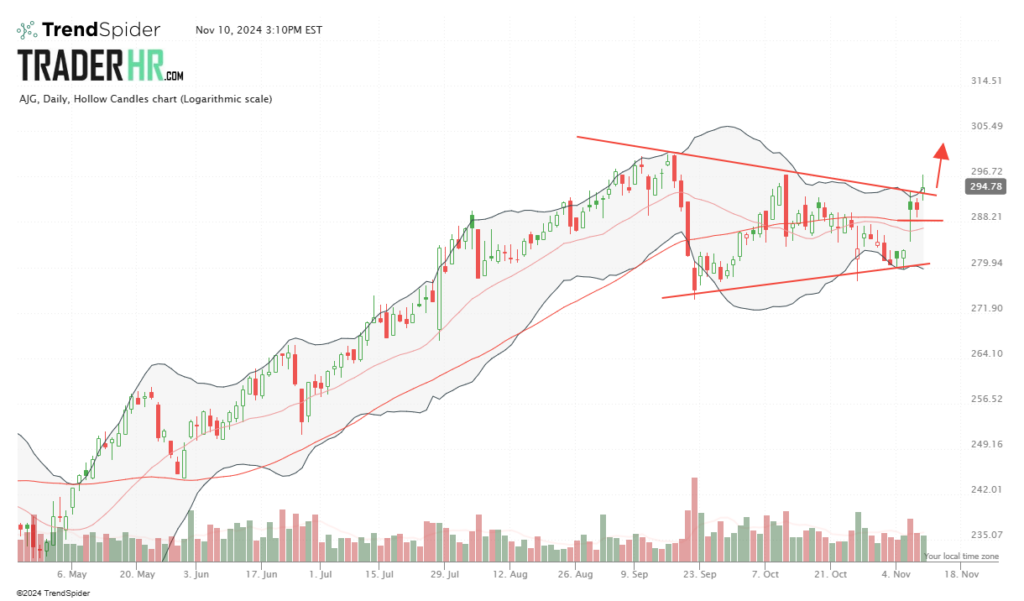
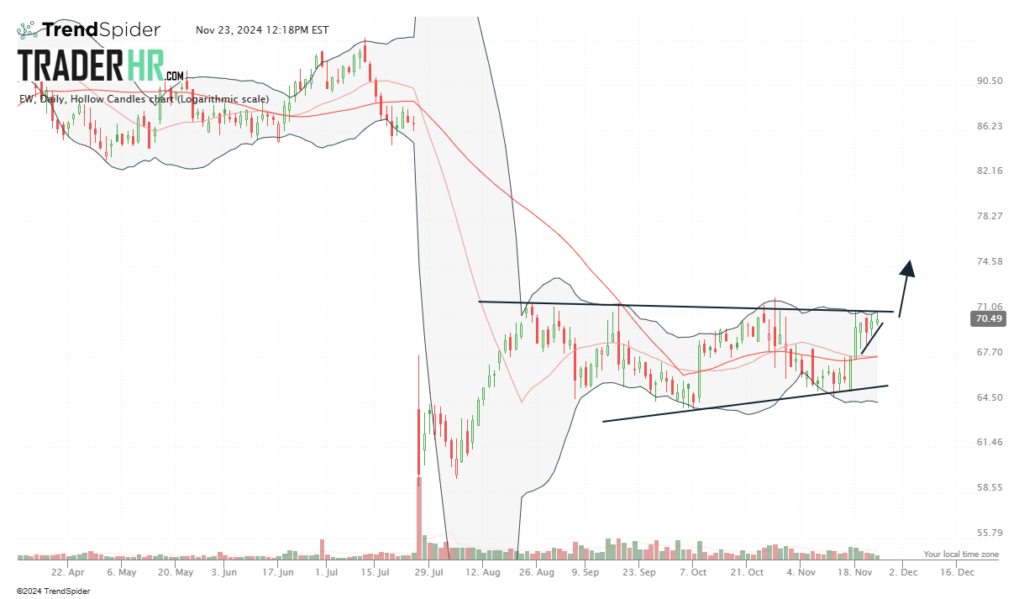
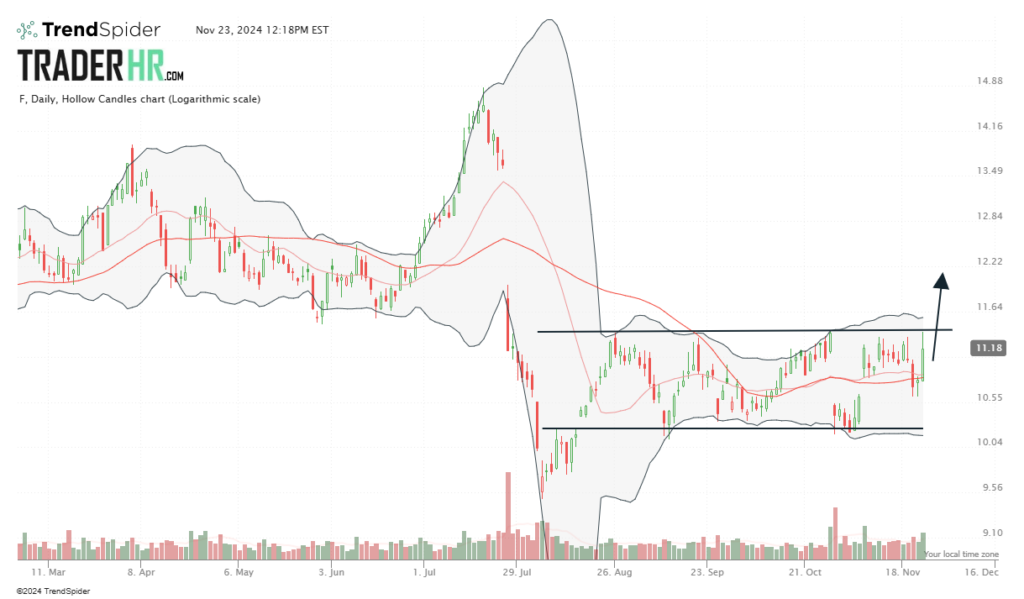
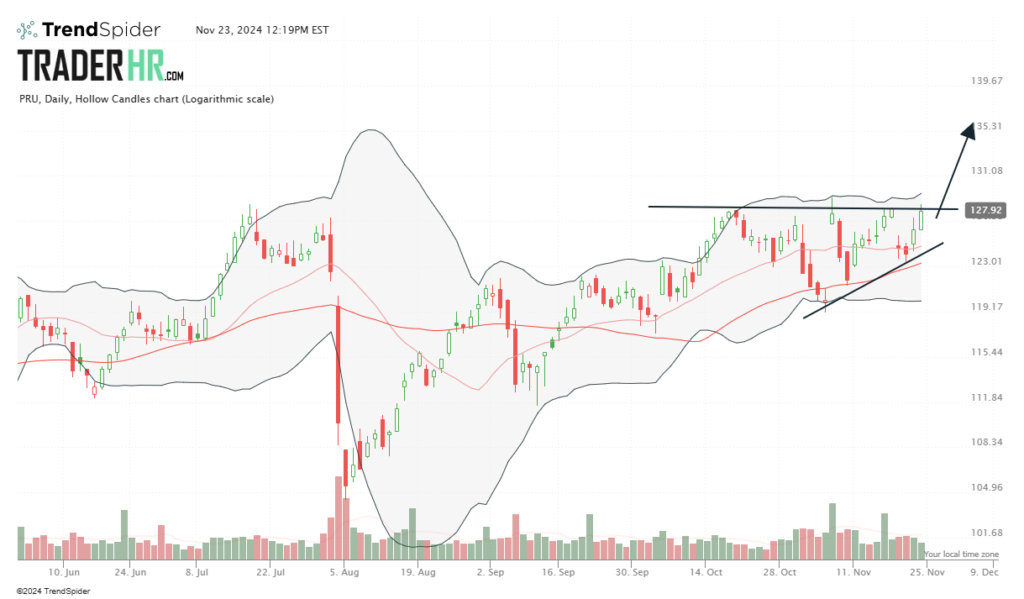
Free Watch List for Nov 25th 2024

Unlock the Premium Trade Alerts with a Full Trading Plan in the Members Area.
"An amazing service. TraderHR is on his game but most importantly will always take the time to answer your questions and teach you the markets."
"I have been with TraderHR for a few months and have had great success. He is not only a great analyst but a great teacher whom I have grown to respect as a trader and a person"
“TraderHR is a proper professional analyst. Clear analysis and trading rules. Always seeking better ways to find better trades.”
I’ve been a member of many sites over the years, and I do the best right here. The daily watch list provides a steady flow of excellent charts to watch. It doesn’t take much work to pick the winners. Thank you very much !
Free Watch List for Nov 25th 2024 Read More »